
The most effective indicators for forex
The main tool with which technical analysis is carried out is the indicator; it is it that allows you to speed up this process.
The main thing is to find the most effective tool for these purposes, since you will have to choose among several thousand different scripts.
The task is quite difficult even for an experienced trader, and if you are just starting to trade Forex, it is not at all feasible.
What forex indicators can be called the most effective for technical market analysis?
Each trader has his own list of preferences, here are the indicators that I use:
Margin Call and Stop Out indicator.
Almost all traders know about such concepts in stock trading as margin call and stop out; the broker is responsible for these parameters and their size can be found on his website.
Margin call is the level of losses on the client’s account, upon reaching which the broker will be obliged to notify the trader.
For example, the margin call is 40%, as soon as the loss reaches this level the broker will call you (in theory).
Stop out is the level of losses upon reaching which the broker will forcefully close the transaction in order to preserve his own funds that were provided as leverage.
Usually equal to 10%. These levels play a greater role for the broker than for the trader, as they protect his funds, but still many investors prefer to monitor such levels.
It is best to use special forex indicators to monitor this parameter.
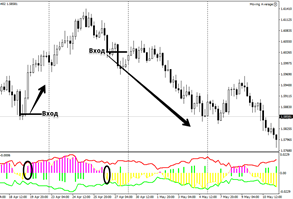
Triple Exponential Average Oscillator
Market irregularities, its constant deceptive maneuvers and oscillatory movements around an invisible axis are the main reasons for losses for most traders.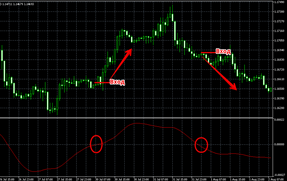
It would seem that the entire trading process comes down to identifying a trend and opening a trade in its direction.
However, in practice, kickbacks are perceived as new trends, and side kicks are perceived as something separate, and not as a regular break that players took for a while.
The so-called market noise is to blame, which can be combated in several ways.
Change the principle of presenting information, as happens with the use of Renko charts, or average the price, using the average price as the basis for analysis.
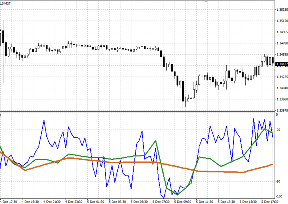
Average Directional Movement Index indicator
A trader needs to clearly understand which direction the market is moving, where it is heading at the moment and where it will go in the near future.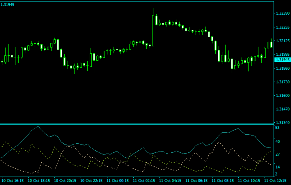
trend forex indicators can cope with this task .
However, despite this, traders continue to suffer losses.
The answer why this happens lies right on the surface, but no one wants to notice it. It is easier to think that forex indicators are wrong about the direction of the trend than to realize that the trend itself has been misjudged.
After all, the effectiveness of the signal in a strong and weak trend will be completely different.
Info indicator for intraday trading
The key problem for newcomers who have just entered the market is a complete lack of understanding of what they are doing, why they are opening a deal and what is behind the performance of certain forex indicators.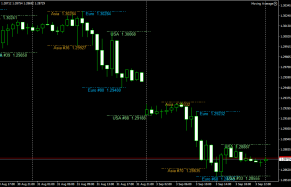
In fact, all market analysis is based on the search and implementation of patterns.
One of these fundamental patterns is the manifestation of price activity at certain times of the day, as well as the formation of strong levels and ranges by traders.
It is trading sessions and price behavior during each of them that can become an excellent core for building an intraday strategy .
In today's article we will look at a script included in the category of forex indicators for intraday trading, which will allow us to visualize a particular trading session on a chart.
TDI indicator
Market analysis and forecasting is difficult to perform without technical analysis tools at hand.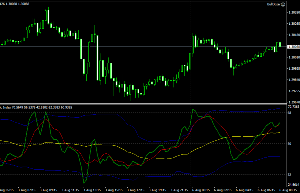
After all, all factors, one way or another, are interconnected and can influence each other.
The direction of the trend, the speed of price movement, volatility, overbought or oversold - all these factors determine the further movement of the price.
That is why in recent years many traders have gradually moved away from using standard forex indicators, which determine one characteristic of the market.
Instead, complex hybrids are increasingly being used. Their essence is that the hybrid can combine from two to five forex indicators in one window and conduct a more professional market analysis.
Fibo Levels Indicator - Trade Channel
The mathematical approach in market analysis is one of the most common, since any strategy is based on the analysis of statistical data, as well as the correct formula for the distribution of capital and risk.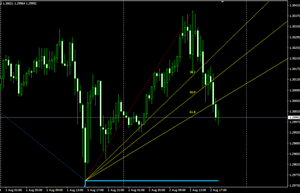
However, behind dry mathematical calculations you can often find the use of so-called magic numbers, often referred to as Fibonacci numbers.
A rather interesting relationship between the proportions of various bodies in living and inanimate nature, which was repeated many times and had the same numbers, excited the minds of many mathematicians.
Naturally, such mysticism did not escape the Forex market, since similar percentage ratios began to be used to analyze the behavior of the crowd, and most importantly, to determine the degree of market correction.
All these tools require the trader to plot them on the chart themselves. As a result, many beginners not only practically do not understand the essence of such tools, but also use them completely incorrectly.
Cayman indicator – trading against the crowd
There are various forex strategies and indicators designed to trade against the crowd in the Forex market.
This is not surprising, because this strategy allows you to make good money.
But at the same time, it has increased risks. Therefore, in order to truly make a profit trading against the crowd, it is necessary to have reliable forex indicators.
One of these is the unique Cayman indicator.
What is this script for, what principles are embedded in it and how it can help traders, further in our article. What does it mean to trade against the crowd?
Despite all the variety of strategies and tools for technical or fundamental analysis, most traders move in one direction. Accordingly, they all get the same, disappointing result.
End of trend indicator on Forex
The nature of the movement of any price asset consists of a certain cyclicality, because any trend ends sooner or later, and then after a while it begins again with greater or lesser force.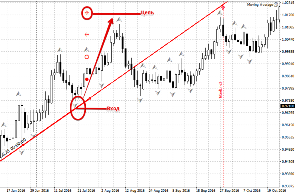
Therefore, in addition to standard indicators, there are also indicators of the end of a trend in Forex. The most interesting thing is that traders, knowing that the market is cyclical, never think about the end of the trend.
Indeed, any price movement is nothing more than a projection of the actions of exchange participants.
Consequently, when the majority of players achieve their goals, for example, to buy an asset at a certain price, the price movement is completed.
Thus, by predicting the end of a trend, a trader can save himself from losses on already open positions.
First RSI level
When trading with oscillators such as RSI or Stochastic, sooner or later you have to face such a problem as indicator lines hanging in overbought and oversold zones.
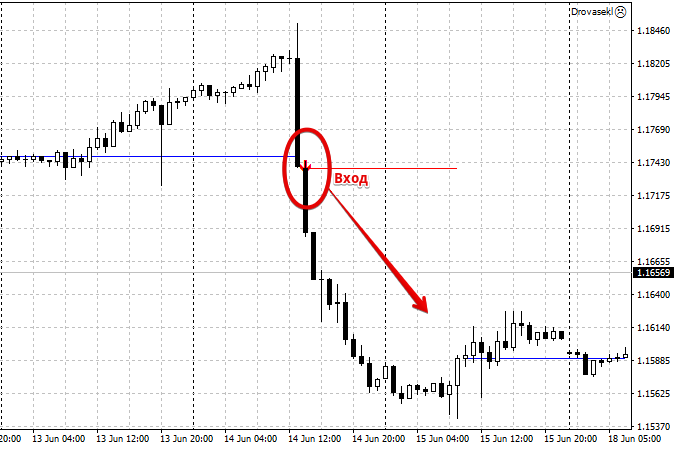
At such moments, the price actively continues its movement towards the trend, while the indicator shows us a reversal.
Many people consider this phenomenon to be a strong drawback and fight it in every possible way, changing the calculation periods and supplementing the script with other technical analysis tools.
However, there were also those traders who conceptually turned this disadvantage around, making it an advantage.
The First RSI level script is a prime example of one of these indicators on forex. The First RSI level indicator is a conceptually new
technical analysis , which is based on the so-called theory of pushing through RSI overbought and oversold zones. In fact, the First RSI level finds the levels of the base of trends, upon the breakdown of which a trader can open positions towards global markets.
MACD Squeeze. An interesting hybrid based on trading zones for MT5.
Standard indicators for forex are not just classics of technical analysis that every trader should take into account, but also a huge field for creating new developments.

The most interesting thing is that sometimes standard forex indicators can be transformed in simply unimaginable ways, from their appearance to the very concept of creating an indicator.
However, if in most cases the modified versions can only boast of a beautiful appearance and, as a rule, unchanged logic, then in today’s article we will look at a fundamentally new MACD.
Which in appearance is practically no different from the standard one, but carries a completely different concept.
The MACD Squeeze indicator is a technical analysis tool that belongs to the group of trend oscillators and is an upgraded version of MACD for the MT5 trading terminal.
A notable feature of MACD Squeeze, which distinguishes it from the standard version, is the search for trading zones, within which the signals of the standard instrument become more accurate.
Indicator measuring Volatility "Extremum"
Volatility is one of the most underestimated characteristics of the market, and the trader pays for it with his deposit.
The volatility indicator, namely its proper calculation, allows you to avoid false triggering of stop orders, set the right goals and achieve them.
This indicator can be used not only as a filter, but also as a basis for creating a trading strategy.
For example, it is known for certain that before any strong reversal or price movement, there is a market compression, after which the price shoots out like a spring and travels huge distances in a matter of seconds.
Thanks to volatility, a trader can find similar market conditions and be prepared for the price to become active soon.
To measure this indicator, forex indicators of the same name are used, one of which is the Extremum indicator, which you will become familiar with in this article.
Zoomer Pro simple scalping
There is simply no doubt about the attractiveness of scalping as a trading style in the Forex market, because it is this style that allows you to achieve the highest profitability in a short time.
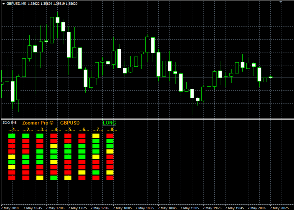
On the other hand, scalping attracts beginners because of its extremely simple and understandable algorithm of actions, since the trader is only concerned with the organization of the process and technical analysis, while one can simply forget about fundamental analysis.
Despite the simplicity of technical analysis, beginners still make mistakes, dismissing the importance of global trends and the trend as such.
The prevailing opinion that a scalper should be interested only in the short-term trend is completely wrong, since older time frames also play an important role.
A simple solution to this problem is to use multi-time frame forex indicators.
Zoomer Pro is one such tool. The Zoomer Pro indicator is a trending multi-time frame technical analysis tool that allows you to build scalping strategies, as well as medium- and long-term strategies according to the principle laid down by Alexander Elder in the strategy called “Three Screens ” .
Delta RSI. Practice of RSI interaction with each other
Classic technical analysis tools such as RSI, Stochastic or Bollinger Bands are described in great detail in many books and websites; moreover, the authors of these tools themselves gave clear and direct instructions for their use.
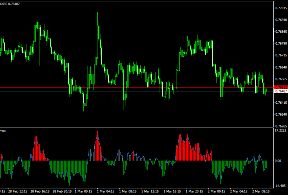
However, traders, in search of effective signals, began to create their own methods for using standard forex indicators, as well as signals, the use of which was not provided even by the developers themselves.
Some of these strategies are absolutely beyond logic, but despite this, many of these applications become classics and give rise to the emergence of other custom indicators.
One such approach is the interaction of two lines of RSI indicators with different periods, and in this article you will get acquainted with the Delta RSI indicator, which implements this type of signal as a separate and independent tool.
The Delta RSI indicator is a custom technical analysis tool that implements the principle of analysis and interaction of two RSIs with different calculation periods among themselves in the form of a histogram.
Price dynamics indicator. Assess overbought and oversold prices in seconds
Not only the trading strategy is the main secret of success in Forex, but the asset being traded also plays an important role.
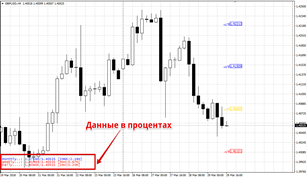
Any story of a successful trader , film or interview about how they conduct their trading begins not with trading, but with a careful selection and formation of a list of promising currency pairs on which to expect movement.
Surely you have a completely logical question: what criteria do traders use to evaluate assets?
As a rule, first of all, the price dynamics are assessed, namely, the percentage that the price has overcome relative to yesterday, week or month is calculated.
This allows you to quickly assess how overbought or oversold the market is and whether you should expect activity from the currency pair.
Volatility indicator with increased efficiency
In the process of trading, probably every trader has come across such a problem when, after opening a trade based on a signal from the strategy, the price stops and comes flat.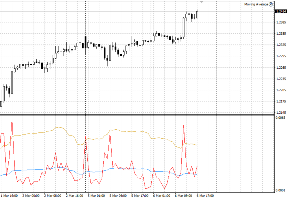
Unfortunately, in 90 percent of cases, such transactions result in losses for the trader, even if closed early.
A completely logical question arises: why does this happen? What is actually missing from a strategy to make it truly effective?
The answer is very simple and lies right on the surface - before opening a position you need to study market volatility!
From this article you will become acquainted with a very effective tool that will help you not only sensibly assess market activity, but also build an impulse trading strategy.
The VolatilityAverageSingleHighLimit Volatility Indicator is a custom technical analysis tool that allows you to not only measure volatility based on the ATR indicator, but also give a clear assessment of how strong market activity is relative to its average over a certain period.
Bitcoin trading indicator
The enormous popularity of cryptocurrencies has appeared not only due to the fact that this asset is characterized by incredible growth rates, which allow large and small investors to receive significant profits just by owning a precious coin.

In fact, cryptocurrencies have the greatest volatility, which implies versatile price movements over a certain unit of time.
The leader in such volatility, of course, is Bitcoin.
It is to this cryptocurrency that the main attention of all traders and speculators in the world is attached, and it is precisely the peculiarities of Bitcoin’s movement that allow them to implement a wide variety of trading strategies on it. In recent years, this asset has become the main refuge of traders using technical analysis and technical indicators.
And since the market is now favorable to all technical analysts, we will look at an indicator for Bitcoin trading in this article.
MACD+OSMA + STOCHASTIC 3XSIG MTF is a comprehensive technical analysis tool based on a number of standard forex indicators, which allows you to evaluate short-term and long-term Bitcoin trends, as well as provide a number of accurate signals to enter the market.
VWMA averaging indicator. An excellent analogue of a simple moving average
The moving average is the instrument on the basis of which the first forex indicators were built. which began to be used long before the advent of online commerce.

Just think, a simple line that shows the average price over a certain time allows you to look at the price without a biased eye, throw unnecessary market noise aside and, most importantly, identify the trend and its changes in time.
However, the same moving average has one huge drawback - all candles for the allotted period are taken into account in its calculation, and the real weight of this candle is not taken into account.
In order to overcome this drawback, a new type of averaging was created that takes into account market volume, and VWMA is built on its basis.
The VWMA averaging indicator is a trend tool for technical analysis, which in its principles of application is no different from the moving average, however, at the same time, in the process of averaging and calculation, volume is taken into account, and in the case of the Forex market, tick volume.
Xprofuter indicator. Future predictor
Technical analysis tools, and especially forex technical indicators, have always been divided into groups depending on what property of the price asset the tool works with and, most importantly, on what principle.

Thus, indicators were conventionally divided into oscillators, trend, volume and information.
However, in recent years, a new category of tools has emerged, namely so-called predictors. The reason for the appearance of this kind of indicators lies in the fact that traders and technical analysts have always wanted to specify their forecasts and forecasts of simple indicators, see a visualization of the forecast and set certain time frames.
Standard technical analysis tools and forex indicators from the above groups simply could not cope with such a task, since, as a rule, they all react to changes in the current market situation, but do not predict the future.
However, the progress of technical analysis has stepped forward so much in recent years that the appearance of such predictive tools no longer surprises anyone.
Multi-Williams Percent Range
A trend, as a state of the market, is a fairly clear and at the same time abstract concept.
The fact is that each trader’s trend, depending on the working time frame, can be different, because it is no secret that the minute chart displays one picture, and the four-hour chart displays a completely different one.
However, the most interesting thing is that both traders can be clearly confident that within the framework of their strategy they see the correct trend or signals.
That is why there is a practice among traders of confirming signals or trend directions on a higher time frame, especially if trading occurs intraday.
Of course, constantly switching between time frames at the moment a signal appears on the main one is quite inconvenient and time-consuming, which is why you can increasingly see indicators with the Multi prefix.
ProfitLine indicator search for breakeven level
In the trading process, every novice trader, and even an experienced one, sooner or later faces a situation when, after opening a profitable trade, the price turns around and goes against the trader, closing the trade with a stop order.
To prevent this from happening, you must always move the stop order to the point without loss.
However, if with one transaction in the market everything is extremely clear, because it is enough to move the stop order after some time to the point at which the transaction was opened, then when working with a series of orders everything is more problematic.
This problem is felt especially critically by traders who use averaging strategies and martingale elements.
But what happens if a trader uses a grid strategy and has simultaneously open orders in different directions?